Graphs
Various control enable you to display a graph. You can display a graph by tapping the 'Access to graph' icon  .
.
The data of the current day will be loaded automatically.
| No. | Meaning |
|---|---|
| 1 | Graph; here you can view data in graph format. |
| 2 | Table; here you can view data in tabular format. |
| 3 | Control data; here you can select multiple data and use the data buttons. |
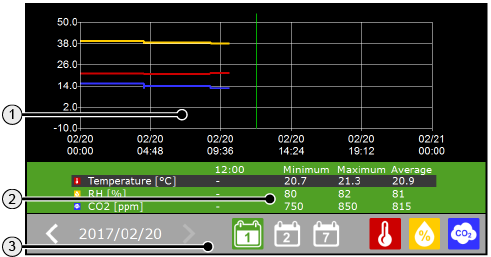
A graph displays one, two or three lines. The number of lines displayed and the meaning of those lines depends on the control that you have selected. In the figure above, you can see three lines that have the following meanings:
- Red = Temperature [C°]
- Yellow = RH (Relative Humidity) [%]
- Blue = CO2 [ppm]
The meaning of the colours is explained in the table below the graph. The meaning of each colour is also conveyed by the coloured buttons with associated icons. You can find these buttons in the bottom right corner of the screen.
X-axis
The X-axis shows the date and clock times. You can change the date using the buttons at the bottom. The clock times will be adjusted accordingly. On the left- and right-hand sides of the graph, you will always see 00:00.

|
This displays the current date by default. You can change the date using the arrow buttons. |

|
This option enables you to view the data from one day (for example: today). |

|
This enables you to view the data from two days (for example: today and yesterday). |

|
This enables you to view the data from seven days (for example: the past week). |
The selected calendar button has a green background.
Y-axis
The numbers on the y-axis are associated with the selected data button. For example, if you select the red button (temperature), then the Y-axis will show the temperature in degrees Celsius. If you select the yellow or blue button, the graph will be adjusted accordingly.
The number of buttons displayed depends on the control that you have selected. One, two or three buttons may be displayed. The icon on the button indicates what type of data you are looking at. For example, the blue button has the CO2 icon.